Crypto Chart Patterns
A crypto trader's guide to common chart patterns.
What are chart patterns?
The price chart of a crypto asset often exhibits repeating trends and patterns over time. Many traders use this information to help predict what the price might do next. While there are many techniques and competing ideologies that go into the field of technical analysis, nearly every trader recognizes the use of chart patterns in some shape or form. Let's go over some of the most common classical chart patterns used by bitcoin and crypto traders.Cup & Handle
The Cup and Handle is a very common bullish pattern that is also easy to recognize. It consists of a U-shaped cup followed by a smaller dip known as the handle. As with every pattern, these trends represent collective market psychology. In this instance, the "handle" occurs due to investors who bought the previous high (when the pattern started). These people immediately lost money on their investment and are excited to simply break even. The rising price at the end of the handle signals to prospective traders that the sellers have exhausted themselves, and that there is still enough buying pressure to break through to a new high.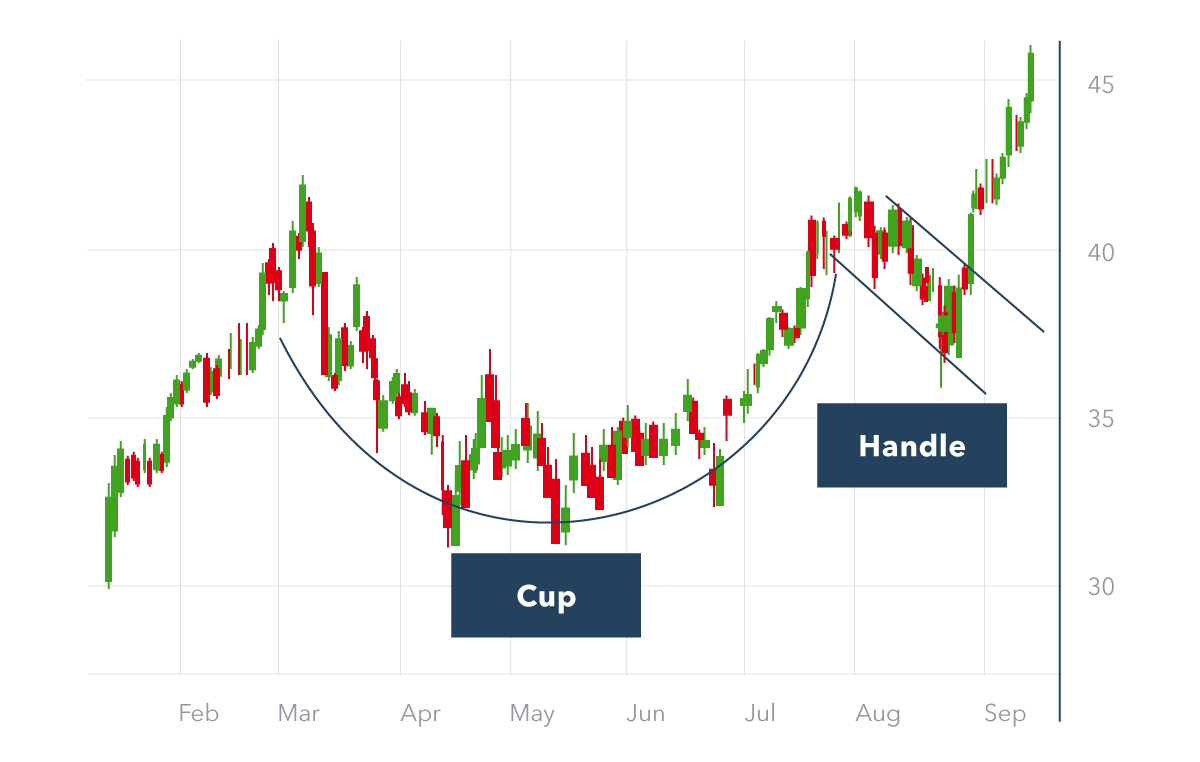 As you can see in this example, patterns are fuzzy approximations. They never look perfect, and they are always open to different interpretations. There is an art to recognizing trends, and this should only be one of many indicators that a trader uses when thinking about placing a trade. The remaining examples below show simplified diagrams.
Ascending Triangle
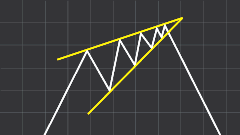
The ascending triangle pattern is also very common, and it takes the form of the asset's price repeatedly bumping up against an invisible line of resistance. Each time the price dips lower, it does so less and less (this is known as making higher lows). Each time a line of resistance is tested, it becomes more likely that it will be broken. This eventually communicates to investors that the price will shoot upward if the pattern resolves itself.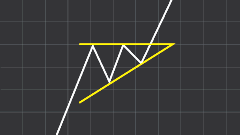 It's worth noting that patterns typically don't completely finish before the price breaks out of the pattern. If bitcoin is forming an ascending triangle and it becomes clear that this is the pattern it's forming, people will jump in sooner rather than later and cause the price to shoot upward before the triangle has completed itself. Traders want to be among the first to recognize a pattern. Sometimes, if you wait too long for confirmation, it will be too late.
Symmetrical Triangle
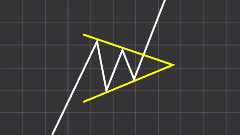 A symmetrical triangle is less bullish than an ascending one, but no less common. It features a price range that is getting more and more narrow, but not favoring a specific direction. This is usually considered a continuation pattern, meaning that a symmetrical triangle will tend to break out in the direction it was already headed before the pattern started. In a bull market, the price usually breaks up. In a break market, it often breaks downward.
Descending Triangle
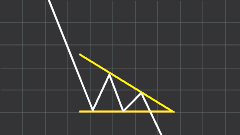 A descending triangle is a bearish version of an ascending one. A lower point of support is repeatedly tested until it can no longer hold. It's worth noting that trading volume is another important aspect of reading chart patterns. Each pattern can have some ideal volume associated with it at different times. While this is largely outside the scope of the article, there is one important thing to know: Trade volume spikes add conviction to a price breakout. If the price breaks down from a descending triangle on high volume, that means the move was legit, and the likelihood of a false breakout is low.
Head & Shoulders
This pattern can be a little tricky to spot at times. A head and shoulders pattern can often be a little lopsided where the shoulders are not level with each other. The shoulders can also be riddled with wicks (see: how to read candlestick charts) making them easy to miss. However, this is a powerful pattern that can be very profitable to spot.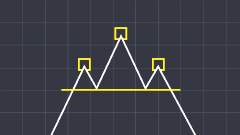 Unsurprisingly, an inverse head and shoulders is the bullish version of the regular pattern.
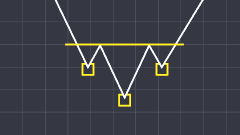
Falling Wedge
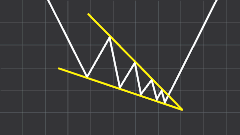 A falling wedge might be a little unintuitive to newcomers. It may look quite similar to a descending triangle, yet it's actually bullish! The main difference is that rather than moving between a flat resistance line and a downward trendline, it zigzags between two downward sloping, converging trendlines.
Rising Wedge
 A rising wedge is the name given to an inverted falling wedge, and is a bearish pattern.
Double Top
A double top is exactly what it sounds like, and it makes a lot of sense from a market psychology perspective. After reaching an all-time-high (or maybe just a local-high), there was enough momentum to test that price a second time. But enough sellers showed up to knock the price back down, signaling that the price rally could be over. Triple tops, while less common, do occur as well.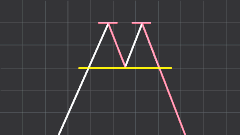
Double Bottom
A double bottom pattern is a bullish version of a double top. It's worth noting that both bottom prices don't need to line up perfectly, and wicks are frequently ignored when it's convenient. When looking at a candlestick chart, a wick is a brief price anomaly, and can often be safely omitted when charting price patterns.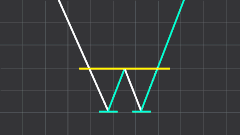
Bear Flag
A bear flag is a very common continuation pattern. After a move downward, the price will often consolidate in a range, appearing to recover slightly, but will not show enough strength to break out from this range in an upward direction. This signals to traders that the selloff has not concluded, and the march downward will continue.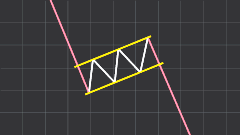
Bull Flag
A bull flag is an inversed bear flag.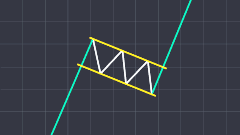
Pennant
This pattern resembles a flag pole, which is where it got its name. It is essentially the same as a flag pattern, but the consolidation phase resembles a symmetrical triangle rather than a parallel trend line. This too, is a continuation pattern.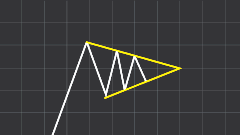
Bart Pattern
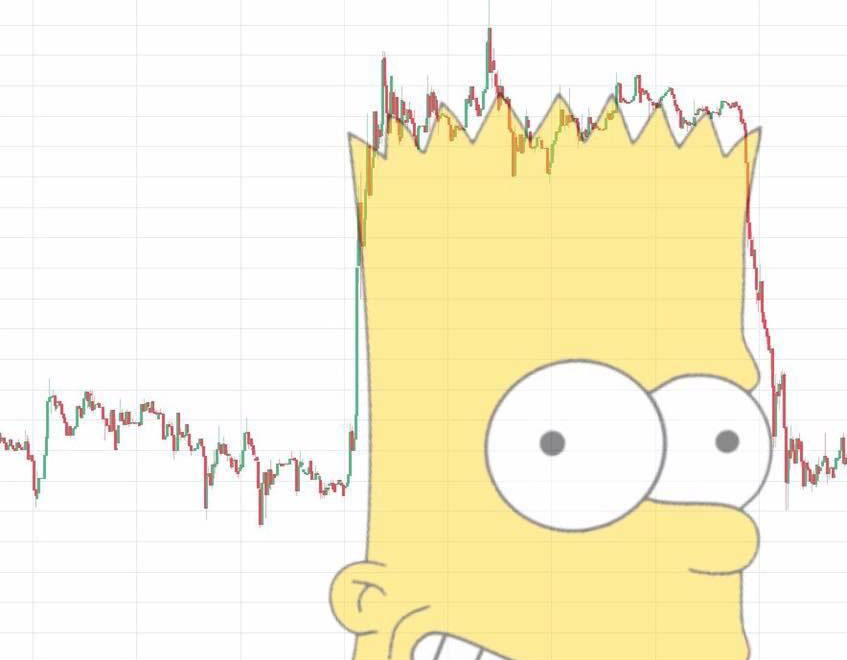 This is more of a meme than a real chart pattern, and there isn't much predictive power behind it. Nonetheless, it's a common pattern found within the bitcoin & crypto space in particular. After a large price move, we will see a consolidation phase of very little price action (Bart's hair). The move then promptly reverses itself. This sideways price action is often known as "chop".
Wrapping Up
A solid understanding of price chart patterns can help give traders an edge. They can help determine investor sentiment, as well as smart places to enter and exit markets. But of course, there is a lot more to trading than reading chart patterns.More Resources