Reading Candlestick Price Charts
A crypto trader's guide to reading price charts and trends.
What is a candlestick chart?
A candlestick chart is the most common way for traders and investors to visualize the price of an asset over time. While they may initially look a bit confusing, candlestick charts have several key advantages over a regular line chart. They can let experienced traders form an opinion on short and long-term price action at a glance. Simply put, they convey more information than a line chart does. While we will be looking at candlestick charts in the context of Bitcoin and crypto trading, these kinds of charts actually date back to the 1700s! One key difference is that crypto markets never close. So you won't see jump from when the market closes one day and opens the next morning.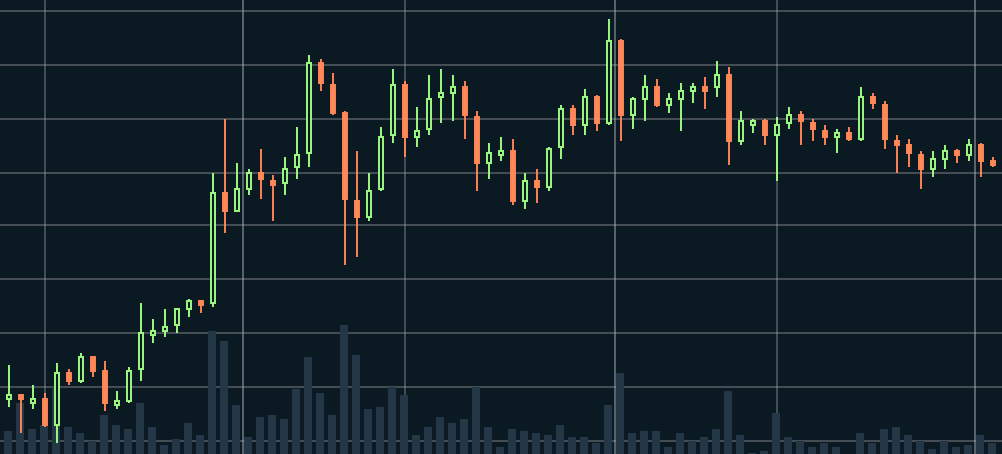 Each candle on the chart can represent an arbitrary amount of time. A 1-day chart, for example, would mean that each candle represents 24 hours. A 5-minute chart means that each candle represents 5 minutes. Typically, the longer the timeframe, the more legitimacy and predictive power a chart is considered to have. Also note that the bar graph on the bottom represents the trading volume for each candle.
How to read a candlestick
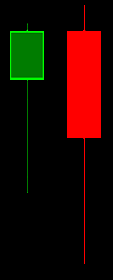
Each candle contains four pieces of information: the Open, the High, the Low, and the Close (OHLC). The following cheatsheet explains the anatomy of a candle. Note that red and green candles have inverted open and close prices.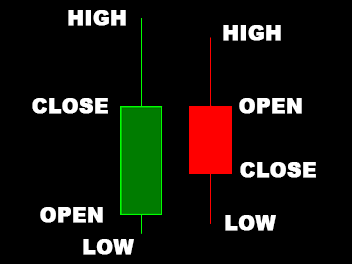 Certain candlestick patterns frequently form, and they can signal a bias in the bullish or bearish direction. While these patterns aim to reflect market psychology, they can also become self-fulfilling. If everyone knows that a certain candlestick pattern is a bullish signal, then everyone may act accordingly. This is especially true in the crypto space, since a large number of trading occurs algorithmically through bots (and there are fewer fundamentals in general). It's easy to program trading bots to follow conventional wisdom such as this.
Remember, red candles mean that the price has gone down during that time period, and green ones mean that the price has gone up. A bullish candle indicates that the price may soon go up, and a bearish candle signals the opposite. A reversal candle implies that a trend is about to switch directions.
Without further ado, here are some common candlesticks patterns used by crypto traders:
Dragonfly Doji
Gravestone Doji

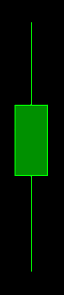
Hammer

Inverted Hammer

Hanging Man

Bullish Engulfing
Bearish Engulfing
Bullish Spinning Top
Bearish Spinning Top

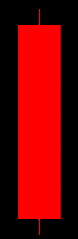
Bullish Marubozu

Bearish Marubozu
Shooting Star

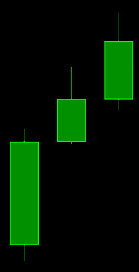
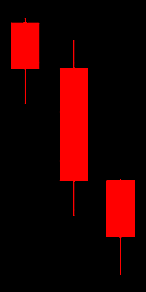
Three Green Soldiers
Three Red Soliders
Related Articles